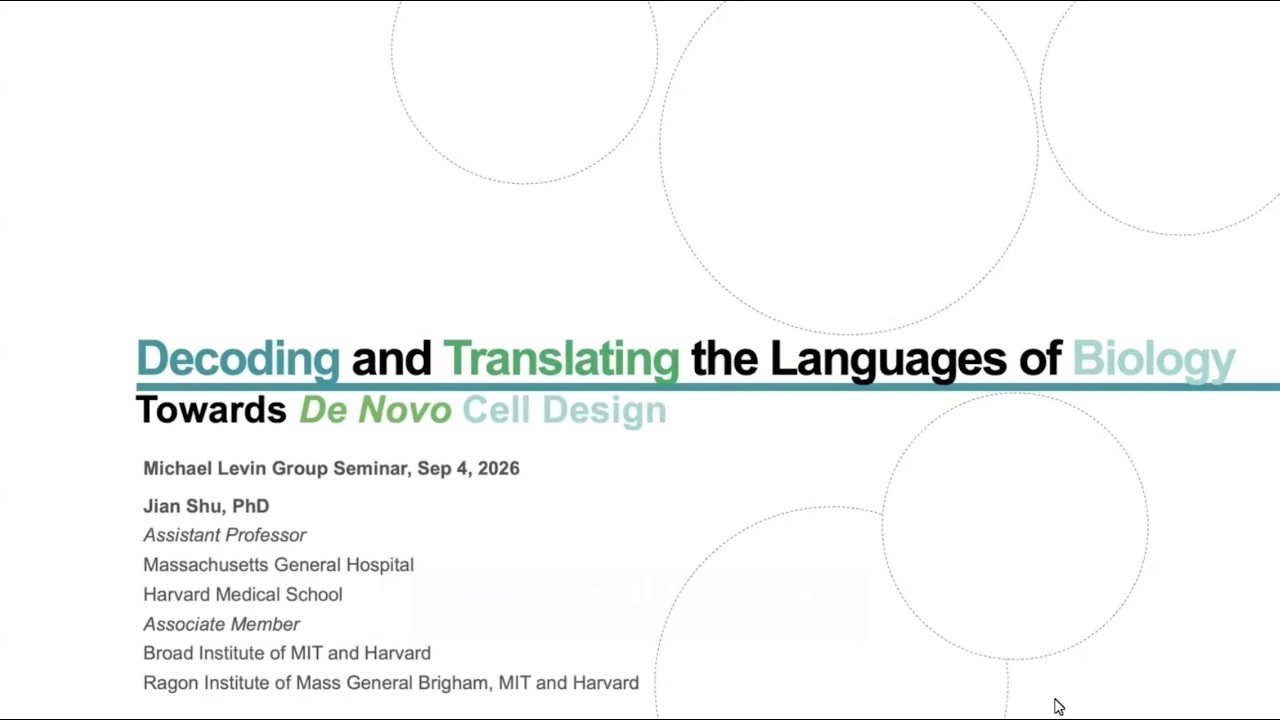
"Decoding and Translating the Languages of Biology: towards de novo cell design" by Jian Shu
This lecture covers stem cell reprogramming and single-cell biology, centered on the speaker's lab research (introduced through what is described as Jian Shu's PhD work) on predicting gene expression from cheaper imaging modalities. The organizing idea is scalable multimodal mapping: pairing imaging techniques like Raman microscopy and H&E staining with single-cell genomics to work around the combinatorial scale problem of screening reprogramming factor combinations across the genome. The speaker walks through a series of lab-developed methods, including Raman2RNA, Ramanomics, SCHAF, GenVinci, and VIP-OT, that predict single-cell RNA-seq and spatial transcriptomics data from imaging alone, framing the broader goal as de novo cell design and proposing a shared 'image-omics-net' database since the field currently lacks a common dataset across consortia. The speaker's institutional role or seminar setting is not stated in the available material.
Concept (00:39): The speaker describes iPS cell invention, Dr. Shinya Yamanaka's discovery about 20 years ago that cells can be reprogrammed into stem cells by overexpressing four genes in fibroblasts.
- Concept (01:51): The speaker's lab proposed a seesaw model, suggesting the balance of different lineage-specifying forces, rather than stem cell factors alone, drives induction of pluripotency.
- Concept (02:25): The speaker identifies Yamanaka's four reprogramming factors as OCT4, SOX2, KLF4, and MYC.
- Concept (03:13): Waddington-OT (OT for optimal transport) is a method the lab developed to align single-cell RNA-seq distributions across time points and reconstruct reprogramming trajectories.
- Concept (05:22): Choosing 4 reprogramming factors out of 20,000 human genes yields about 6.67 x 10^15 (6.67 quadrillion) possible combinations, making one-by-one screening essentially impossible, per the speaker.
+ 48 more takeaways
- Concept (05:48): The speaker states that screening that many combinations one by one is impossible even with single-cell sequencing, RAID, or pooled optical screens.
- Concept (06:20): The speaker states live-cell mapping is needed because biology is dynamic and time is missing from most current measurements.
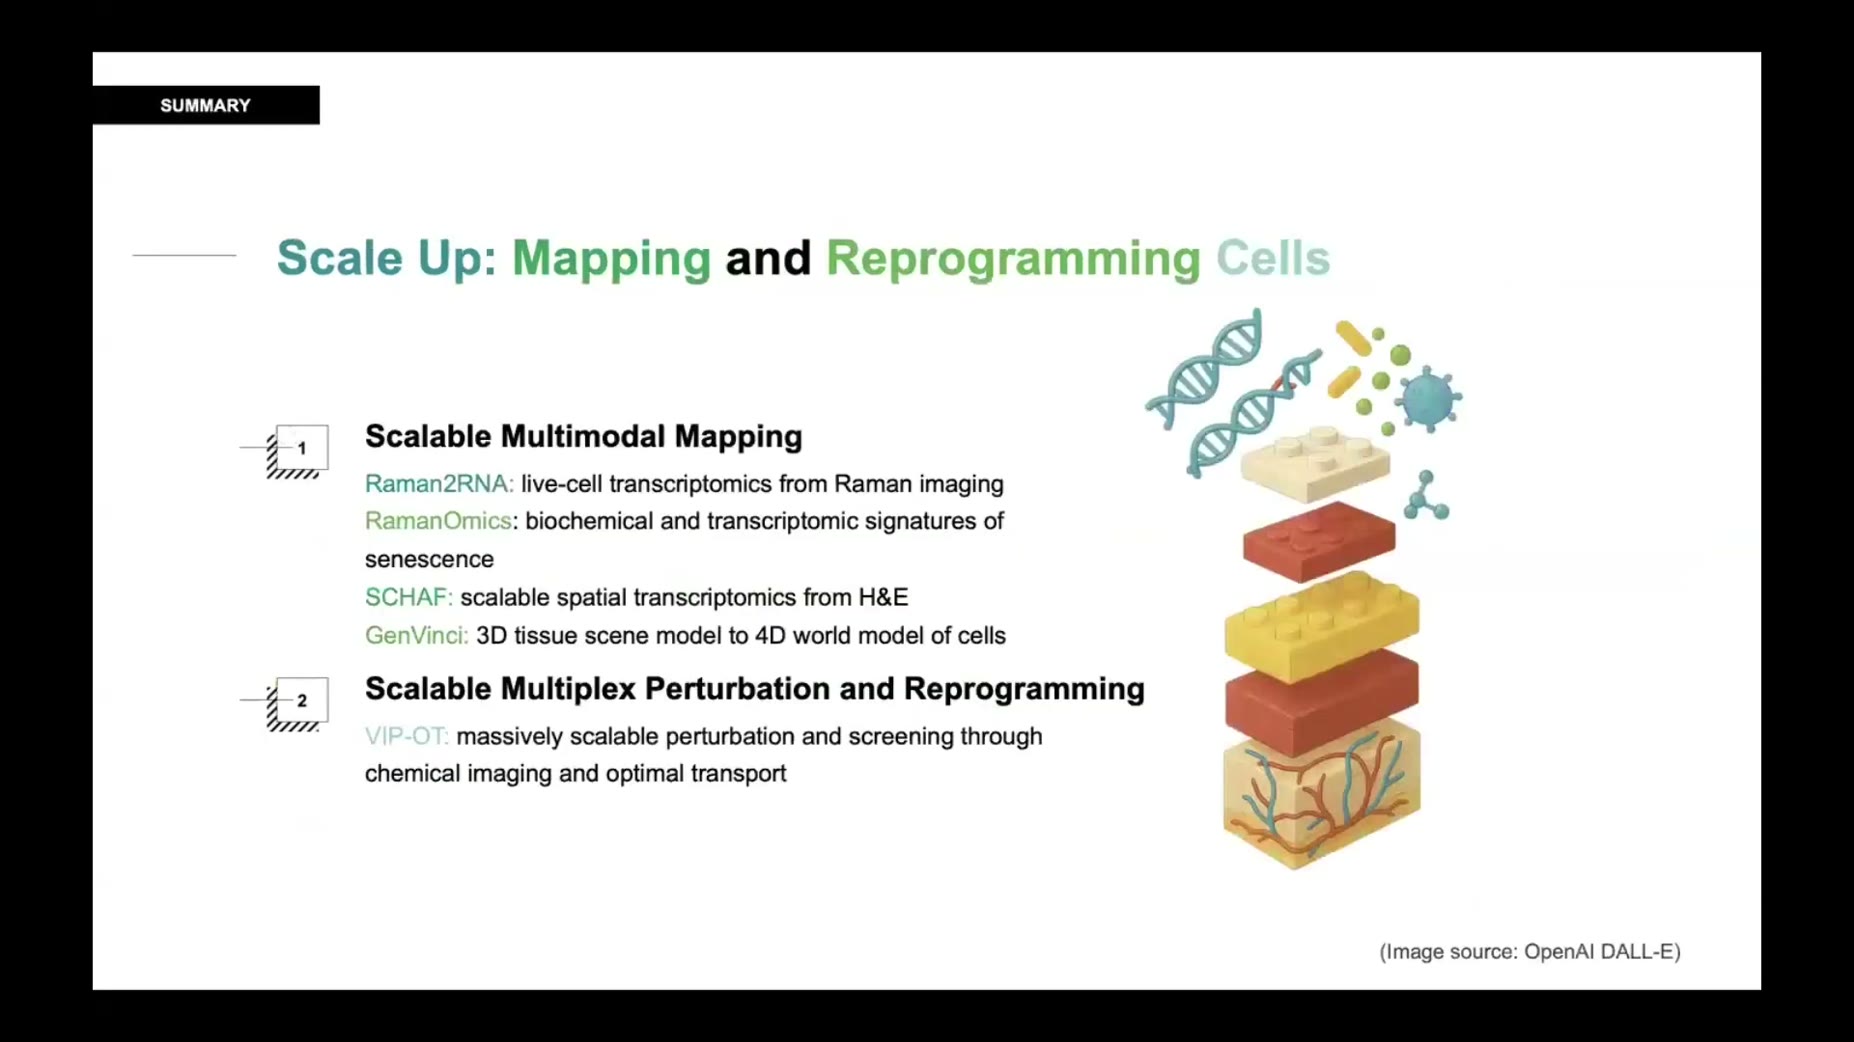
- Concept (06:34): The lab's stated strategy combines scalable multimodal mapping with scalable multiplex perturbation and reprogramming tools.
- Concept (07:19): Single-cell sequencing is destructive, requiring cell lysis, which prevents tracking the same cell over time or using it in vivo, as explained by the speaker.
- Concept (07:38): The speaker contrasts microscopy, which is low cost, high throughput, and robot-compatible, against its imaging features usually being very difficult to interpret.
- Concept (09:10): Single-cell genomics measurements are high dimensional (20,000 genes) while most biological imaging measurements are low dimensional with very limited channels, per the speaker.
- Concept (10:39): Raman microscopy is described as chemical imaging that measures light-molecule interactions, with molecules vibrating at different frequencies based on chemical bonds, producing spectra up to 1000 dimensions per pixel.
- Concept (18:24): The team introduced a multimodal senescence barcode combining differential Raman peaks and scRNA-seq differentially expressed genes to distinguish senescent from non-senescent cells.
- Concept (35:52): The speaker states that achieving de novo cell design requires massive scalable genotyping tools.
- Concept (36:43): The speaker proposes building an 'image-omics-net,' analogous to ImageNet and the Protein Data Bank, as a shared resource for the cell biology community.
- Mechanism (02:25): The lab systematically replaced each of Yamanaka's four factors with another gene in a genome-wide arrayed screen, as described by the speaker.
- Mechanism (04:26): Using the Waddington-OT approach, the lab sequenced about 300,000 cells and identified two previously unstudied potential reprogramming boosters, GDF9 and BOX6.
- Mechanism (12:06): The experiment grew cells on a culture dish from day 8 to day 14 of iPSC reprogramming, during which heterogeneity emerges as different subtypes arise from fibroblasts.
- Mechanism (12:29): Raman microscopy images were paired with single-molecule FISH on the same cells to measure marker/anchor genes, linking Raman features to single-cell RNA-seq data.
- Mechanism (14:18): In leave-out validation, prediction performance was around 0.8, but the fibroblast marker gene Col1A1 performed poorly, which the speaker suggests may be because it is expressed across multiple cell types (neuronal-like, trophoblast-like, stromal fibroblast).
- Mechanism (15:55): In a time-lapse proof-of-principle, stem cells were treated with retinoic acid over three days and differentiated into epiblast, ectoderm, and extraembryonic lineages, using bright field, Raman, and single-molecule FISH snapshots to train a model linking these modalities to single-cell RNA-seq.
- Mechanism (16:18): In the training phase, the team took bright field imaging, Raman imaging, and single-cell RNA-seq snapshots at different time points over three days.
- Mechanism (16:43): The team separately ran live-cell imaging with Raman and brightfield alone, without tracking cells over days, to test prediction from imaging only.
- Mechanism (17:07): Live-cell Raman videos were taken over 72 hours to predict gene expression and cell type marker dynamics.
- Mechanism (20:48): Lipid was found to be highly enriched in senescent cells from both Raman measurement and gene expression data.
- Mechanism (29:27): Using human skin tissue, the team cut serial sections, took conventional 2D H&E images, reconstructed 3D H&E from the 2D serial sections, and then inferred 3D spatial transcriptomics from the reconstructed 3D H&E.
- Mechanism (30:15): In the reverse direction, GenVinci-2 generates predicted cell morphology images from gene expression alone, which the speaker compares to text-to-image models like DALL-E.
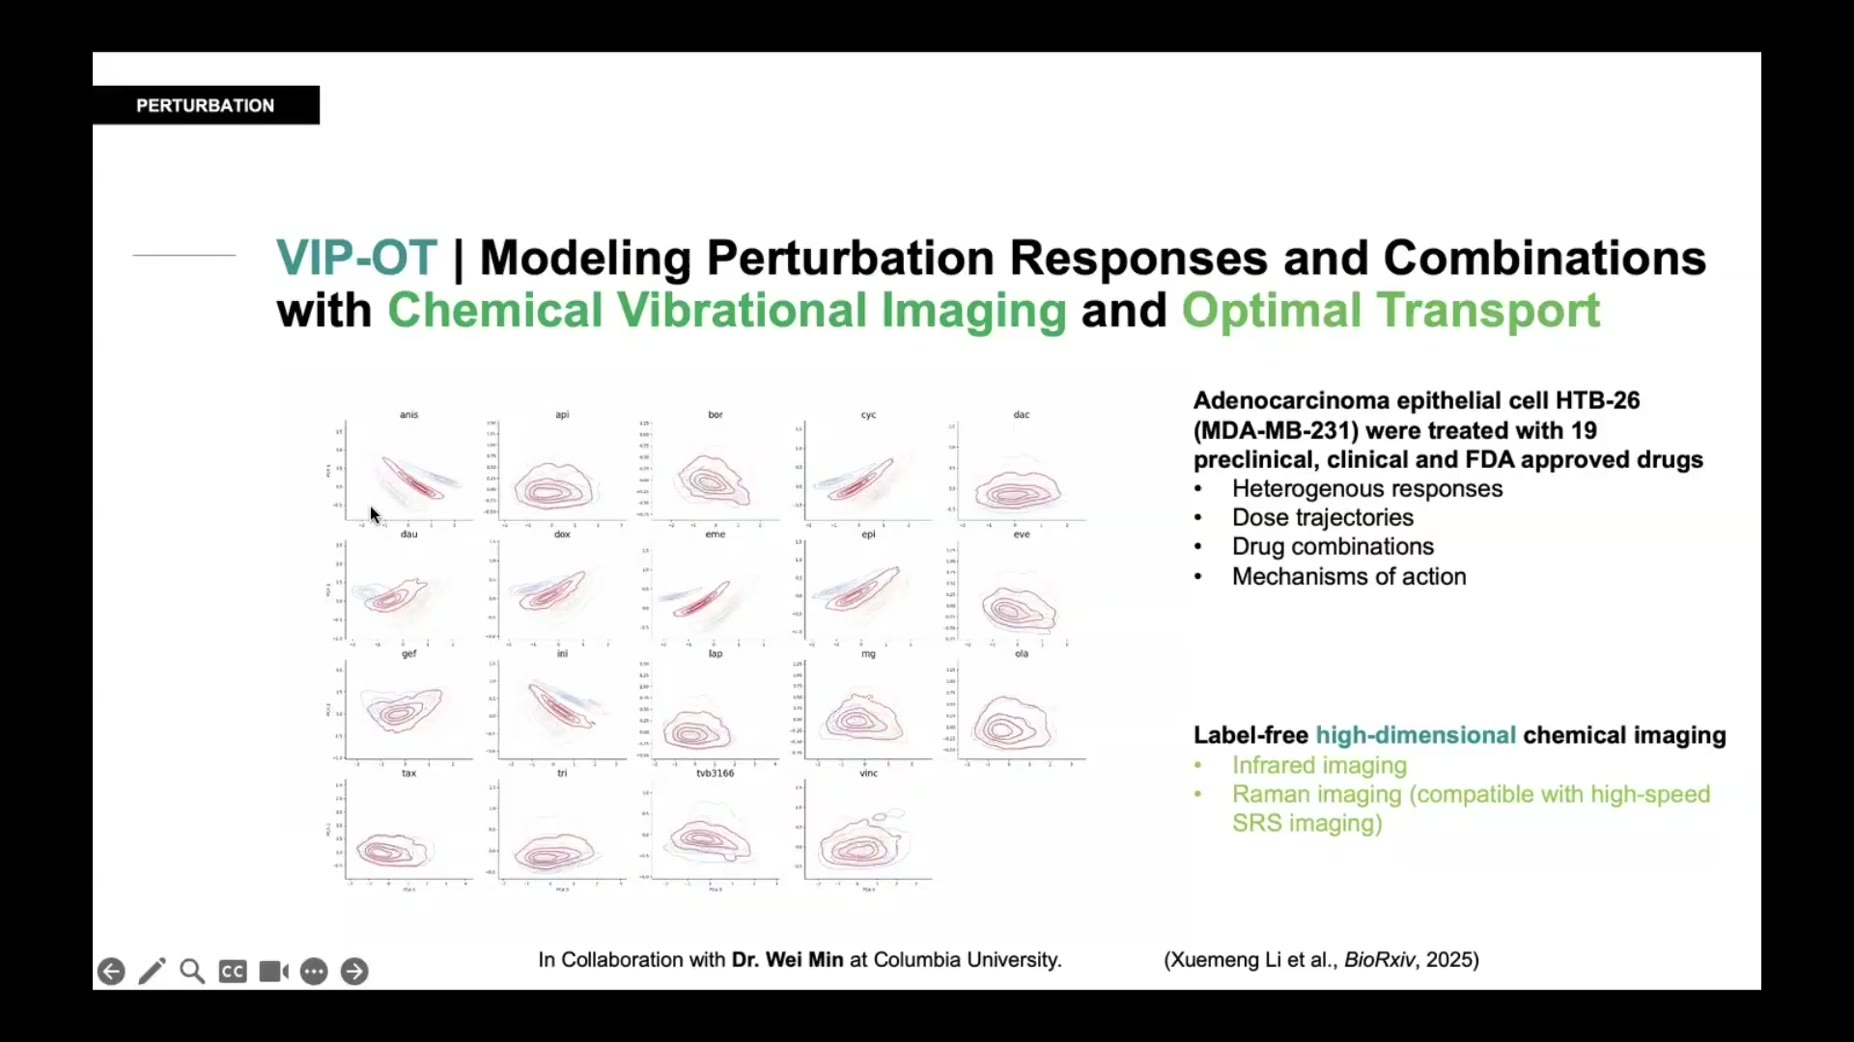
- Mechanism (32:58): VIP-OT (vibrational imaging painting with optimal transport) treats the HTB-26 (MDA-MB-231) adenocarcinoma epithelial cell line with 19 preclinical, clinical, and FDA-approved drugs, using label-free Raman and infrared chemical imaging combined with optimal transport to track dose trajectories, heterogeneous responses, drug combinations, and mechanisms of action.
- Mechanism (34:46): Different drugs can be clustered based on their Raman or infrared chemical imaging features after treatment, per the speaker.
- Mechanism (35:07): Three specific drugs with similar post-treatment spectral information are all protein synthesis inhibitors, indicating a shared mechanism of action, as stated by the speaker.
- Mechanism (36:03): The lab has spatial omics tools, SpatialVariant-Seq and SpatialHost-Microbe-Seq, to spatially map mutations and microbial species in situ.
- Named study/source (01:17): The speaker attributes to Jian Shu's PhD work (Shu et al, Cell, 2013; Shu et al, Cell Research, 2015) the finding that iPS cells or stem cells can be induced using lineage specifiers, challenging the conventional pluripotency dogma.
- Named study/source (10:19): Raman-to-RNA (Raman2RNA), also called Image2Omics, is credited as developed with Aviv and Peterson at MIT and Tomaso at Genentech.
- Named study/source (10:24): The speaker states Raman2RNA was the first method to show it is possible to predict single-cell RNA-seq from Raman microscopy.
- Named study/source (15:03): The speaker reports a correlation of around 0.8 between predicted single-cell RNA-seq (from Raman imaging alone) and ground truth single-cell RNA-seq.
- Named study/source (17:48): The speaker frames Raman2RNA as having laid the foundation for integrating different data modalities in the lab's later methods.
- Named study/source (17:54): A second method, Ramanomics, integrates Raman imaging with single-cell spatial transcriptomics directly, and the speaker states it is about to be published in Nature Aging.
- Named study/source (18:24): The senescence barcode method is described as validated in a mouse lung P21 model and a wound healing model.
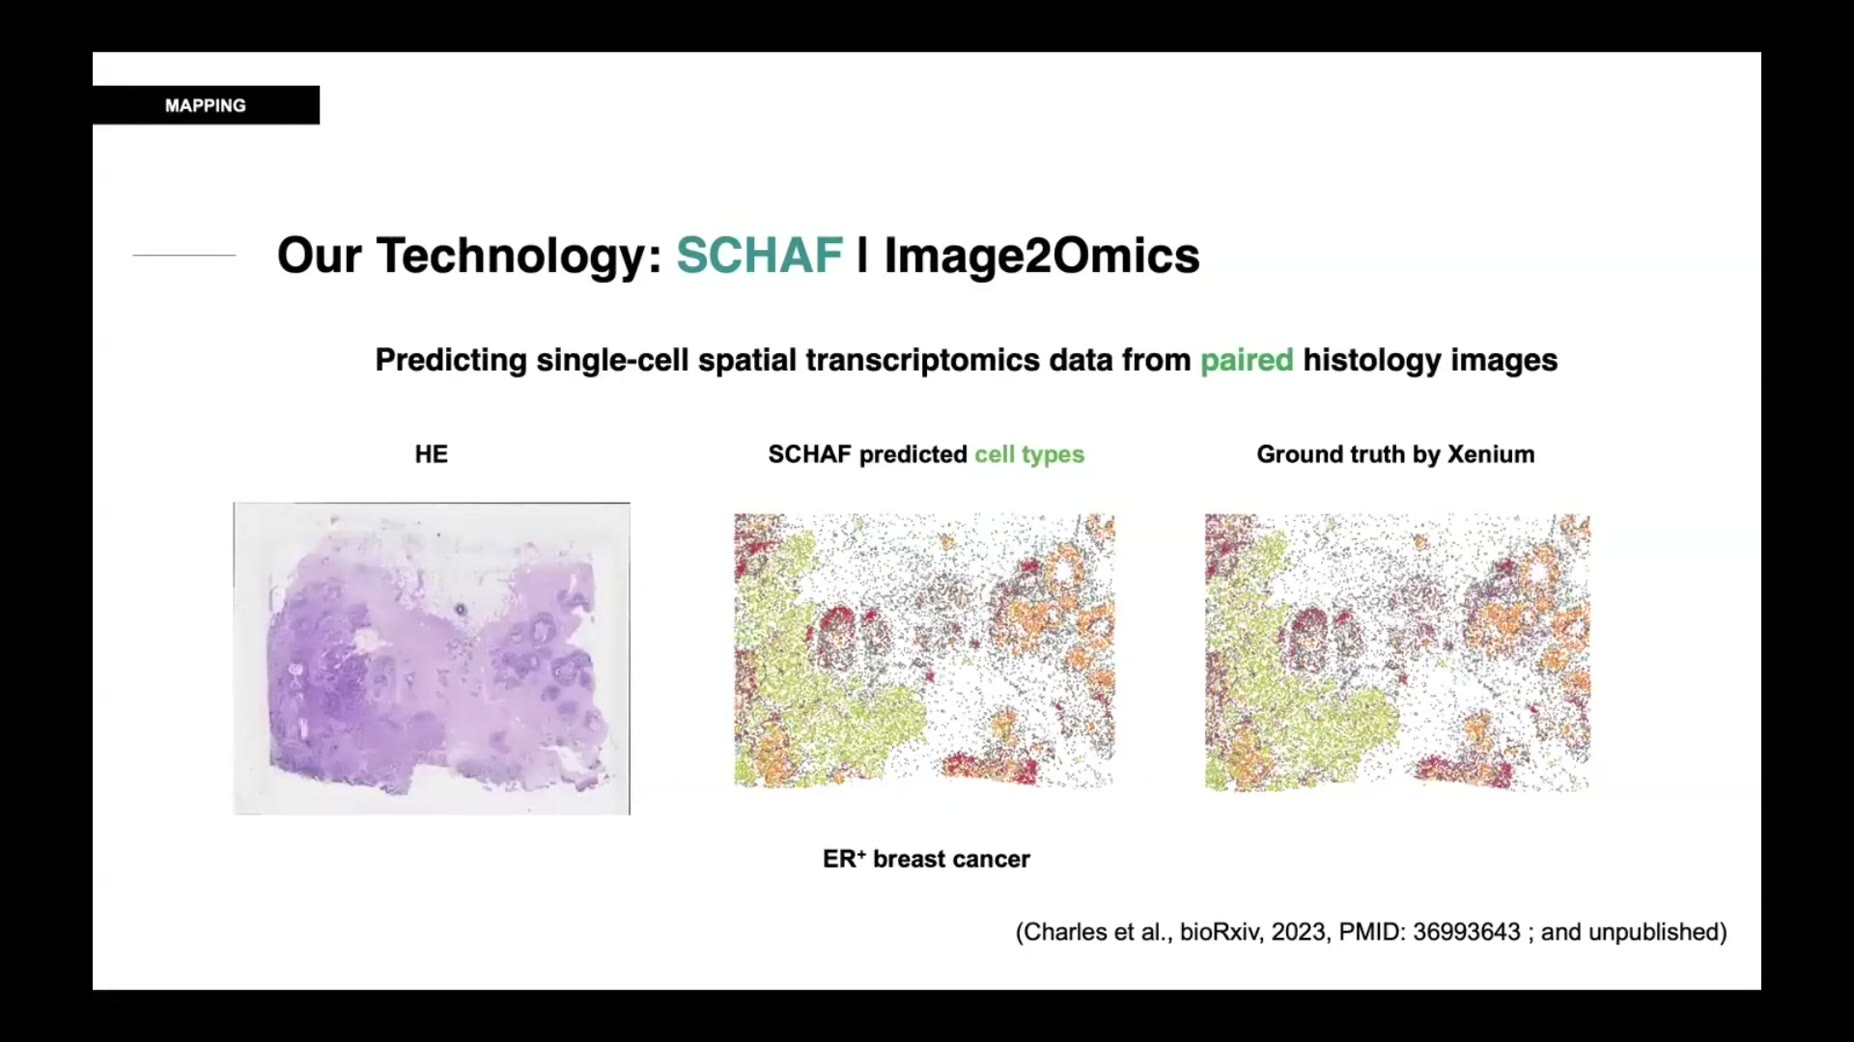
- Named study/source (22:16): A method called SCHAF (also called Image2Omics) uses H&E stain images to predict single-cell RNA-seq and spatial transcriptomics data; the speaker states it took over six years to develop, is still under revision, and is not yet generalizable due to insufficient paired H&E and single-cell gene expression training sets.
- Named study/source (no timestamp provided in source, within the 22:49-28:56 window): The speaker describes SCHAF's ER-positive breast cancer validation, where the model was trained on other ER-positive breast cancer samples and tested on a new sample whose H&E and spatial transcriptomics data it had never seen.
- Named study/source (no timestamp provided in source, within the 22:49-28:56 window): At the cell-type level, SCHAF's prediction compared to 10X Xenium ground truth performed well within the same tissue type (breast cancer), but the speaker notes performance would be much worse on an unrelated tissue like brain.
- Named study/source (no timestamp provided in source, within the 22:49-28:56 window): For the ERBB2 tumor gene, SCHAF showed a spatial correlation of around 0.8 between predicted and ground truth, though the speaker flags this as one of the best-performing genes, not representative of all genes, and attributes the limitation to a data problem rather than a model problem.
- Named study/source (no timestamp provided in source, within the 22:49-28:56 window): In another tumor example, individual gene prediction correlation was around 0.7 compared to spatial transcriptomics ground truth, with subtle disagreement at the cell-type level too.
- Named study/source (28:33): A new method called GenVinci was developed to scale H&E-to-omics prediction into 3D, trained on more than 250 million single-cell RNA, spatial transcriptomics, and H&E data points in a database called ImageOmicsNet.
- Named study/source (29:14): The speaker states the model learns general embeddings from imaging and gene expression that generalize, enabling reconstruction of spatial gene expression at the 3D level from a routine 2D H&E image.
- Named study/source (30:52): Ground-truth neuron images came from PatchSeq data by the Allen Institute, and GenVinci generated five additional images based only on gene expression, compared quantitatively to the ground truth.
- Named study/source (37:09): The speaker summarizes the methods covered: Raman2RNA and RamanOmics (predicting single-cell RNA-seq from Raman imaging), SCHAF and GenVinci (using H&E in 2D and 3D), and VIP-OT (combining Raman/SRS/infrared imaging with small molecule perturbation).
- Comparative example (no timestamp provided in source, within the 22:49-28:56 window): Using human placenta tissue where the H&E was cut later from a different slice than the single-cell/spatial transcriptomics data (an unpaired situation), SCHAF could still generate single-cell and spatial transcriptomics data with quantified uncertainty, though the speaker says performance was much worse than in paired settings.
- Comparative example (31:28): The speaker describes Patch-seq as very difficult, slow, and low throughput, motivating the gene-expression-to-image generation approach.
- Comparative example (32:00): The speaker notes it took many years to build just the EM/connectome atlas of Drosophila and mouse at small scale, versus having over 250 million single-cell RNA-seq data points already available, motivating using gene expression to generate EM-like images.
- Comparative example (35:17): The speaker states imaging-based drug clustering is potentially scalable because it has no running cost and no reagent cost.
- Why it matters (no timestamp provided in source, within the 22:49-28:56 window): The speaker argues philosophically that no single measurement, including pathologist annotation, is ground truth, since every measurement captures only a partial view of the real state, so some disagreement between predictions and pathologist annotations is expected.
- Why it matters (36:42): The speaker states the field lacks an organized, shared dataset because every consortium stores its own data separately, with no common database, motivating the proposed image-omics-net resource.
How this brief was shaped: Lecture / Educational Explainer · confidence Medium
A single named professor at a Michael Levin Group Seminar presents concepts and named research (Yamanaka iPS cells, single cell genomics history) with slides laying out definitions and tradeoffs, matching an academic lecture context rather than a procedural tutorial or argued thesis.
The lens sets this brief's structure, never its facts — every claim is held to the same citation and fact-check standard.